
How to Turn Dead Data into Decisions — in Just 4 Hours
Transform Your Charts, Your Text, and Any Pile of Numbers into a Story That Sells
If you can't explain it simply, you don't understand
it well enough.
Albert Einstein

ABOUT THE AUTHOR
Sam Schreim, the best‑selling author behind Storytelling Charts, will hand you the same playbook he gives Fortune 500 teams. Two fast‑paced, live sessions. One mission: transform your data into a story that sells, persuades, and unlocks budget — every single time.

Why This Matters to You — Right Now

Decision‑makers tune out charts — they tune in stories. Keep feeding them raw numbers and watch your influence evaporate.

AI is rewriting the rules. Get ahead, or chase the pack later.

Attention spans are collapsing. You have 7 seconds to hook the room. Make every slide fight for its life.
If you conduct presentations to bosses, boards, classrooms, or
clients — this workshop pays for itself the first time you open your presentation maker.
It's Time to Transform Your Data from a Confusing Burden into Your Most Powerful Communication Asset
What You'll Walk Away With:

Charts That Command Attention
Design visuals that land your message the first time — clear, sharp, and impossible to ignore.

AI That Works for You
Learn how to harness today's smartest tools to cut hours from your workflow and surface insights your competitors miss.

Arguments that Stick
Build bulletproof cases using the same thinking taught at Harvard. Turn data into trust—and trust into action.

Narratives That Flow Like a Story, Not a Spreadsheet
Master the Vertical Logic™ framework and guide your audience effortlessly from point A to "I'm sold."

Confidence That Carries into Every Room
Step into meetings knowing your charts don't just inform—they persuade, inspire, and drive decisions.

Authority That Gets You Noticed
Become the person people call when clarity is critical and results matter.
How to Turn Dead Data into Decisions — in Just 4 Hours
Transform Your Charts, Your Text, and Any Pile of Numbers into a Story That Sells

If you can't explain it simply, you don't understand
it well enough.
- Albert Einstein
ABOUT THE AUTHOR
Sam Schreim, the best‑selling author behind Storytelling Charts, will hand you the same playbook he gives Fortune 500 teams. Two fast‑paced, live sessions. One mission: transform your data into a story that sells, persuades, and unlocks budget — every single time.
Why This Matters to You — Right Now
Decision‑makers tune out charts — they tune in stories. Keep feeding them raw numbers and watch your influence evaporate.
AI is rewriting the rules. Get ahead, or chase the pack later.
Attention spans are collapsing. You have 7 seconds to hook the room. Make every slide fight for its life.
If you conduct presentations to bosses, boards, classrooms, or
clients — this workshop pays for itself the first time you open your presentation maker.
It's Time to Transform Your Data from a Confusing Burden into Your Most Powerful Communication Asset
What You'll Walk Away With:
Charts That Command Attention
Design visuals that land your message the first time — clear, sharp, and impossible to ignore.
AI That Works for You
Learn how to harness today's smartest tools to cut hours from your workflow and surface insights your competitors miss.
Arguments that Stick
Build bulletproof cases using the same thinking taught at Harvard. Turn data into trust—and trust into action.
Narratives That Flow Like a Story, Not a Spreadsheet
Master the Vertical Logic™ framework and guide your audience effortlessly from point A to "I'm sold."
Confidence That Carries into Every Room
Step into meetings knowing your charts don't just inform—they persuade, inspire, and drive decisions.
Authority That Gets You Noticed
Become the person people call when clarity is critical and results matter.
Picture This:
You walk into your next meeting armed with slides so clear the room leans in. Questions turn into nods. Colleagues quote your insights verbatim. You leave the room with a green light — and a reputation as the person who "makes data talk."
This is your edge. In a world drowning in dashboards, the ability to tell a sharp, strategic story is your superpower.
Join The Workshop
Own The Room
The Power of Integration —
Why This Isn't "Just Another Course"
01
AI‑Powered Storytelling
Use the latest tools to go from raw data to polished slides at lightning speed.
02
Harvard Case Method
Practice on real‑world complexity, not textbook fluff.
03
Critical‑Thinking Frameworks
Nail the "so what" every time.
04
Vertical
Logic
Ensure every element drives the narrative forward.
The result? A method you can deploy Monday morning —
and every presentation after.
The Power of Integration —
Why This Isn't "Just Another Course"
01
AI‑Powered Storytelling
Use the latest tools to go from raw data to polished slides at lightning speed.
02
Harvard Case Method
Practice on real‑world complexity, not textbook fluff.
03
Critical‑Thinking Frameworks
Nail the "so what" every time.
04
Vertical Logic
Ensure every element drives the narrative forward.
The result? A method you can deploy Monday morning —
and every presentation after.
What Makes This Workshop Different?
Typical Data‑Viz Webinar
Storytelling Charts™ Workshop
Interactivity
Scope
Technology
Framework
Credibility
100% lecture
Tool tips only
Static
None
Random Instructor
Hands‑on with live exercises & feedback
Strategy and execution (story → slide → delivery)
AI‑powered workflows you can use tomorrow
Vertical logic and consulting-grade slide narrative
Taught by the best‑selling author of Storytelling Charts
What Makes This Workshop Different?
Typical Data-Viz Webinar vs Storytelling Charts™ Workshop
Typical Webinar: 100% lecture
Workshop: Hands-on with live exercises & feedback
Typical Webinar: Tool tips only
Workshop: Strategy and execution (story → slide → delivery)
Typical Webinar: Static
Workshop: AI-powered workflows you can use tomorrow
Typical Webinar: None
Workshop: Vertical logic and consulting-grade slide narrative
Typical Webinar: Random Instructor
Workshop: Taught by the best-selling author of Storytelling Charts
What You Get — No Gobbledygook,
Just Value
What
Why It Matters
Real Wold Value
Two-day live workshop - 2-hour session each day
Learn ➜ practice ➜ perfect
$500
AI Prompt Cheat Sheet
Shave days off every deck
$49
Story Telling Chart Templates
Ready‑made, real-life exec‑tested
$49
Vertical Logic Worksheet
The framework that firms like McKinsey, Bain and BCG guard jealously
$49
1‑Year License: Storytelling with Charts Pro
Automatic grunt work
$200
Follow‑Up Q&A Call
Feedback after the dust settles
$100
TOTAL VALUE
$927
What You Get — No Gobbledygook,
Just Value
What's Included
2-hour session each day
Why It Matters: Learn ➜ practice ➜ perfect
Real World Value: $500
Why It Matters: Shave days off every deck
Real World Value: $49
Why It Matters: Ready-made, real-life exec-tested
Real World Value: $49
Why It Matters: Framework firms like McKinsey, Bain, and BCG guard jealously
Real World Value: $49
Why It Matters: Automatic grunt work
Real World Value: $200
Why It Matters: Feedback after the dust settles
Real World Value: $100
You'll Walk Away Able To
01
Frame insights in a story that busy executives and clients instantly grasp.
02
Cut deck‑building time by 90% by harnessing AI for outlines, visuals, and wording.
03
Apply Harvard Business School case‑method thinking to real‑world data problems.
04
Structure presentations with bullet‑proof vertical & horizontal logic so every slide earns its spot.
05
Deliver persuasive visuals that win budget approvals, client buy‑in, or student engagement.

About The Author
Sam Schreim
Sam Schreim is a global consultant and data storytelling expert who has helped Fortune 500 companies, startups, and government agencies turn complex information into clear, compelling narratives.
Over a 20-year career spanning management consulting, venture capital, and executive coaching, he has developed frameworks and tools that bridge logic, design and persuasion.
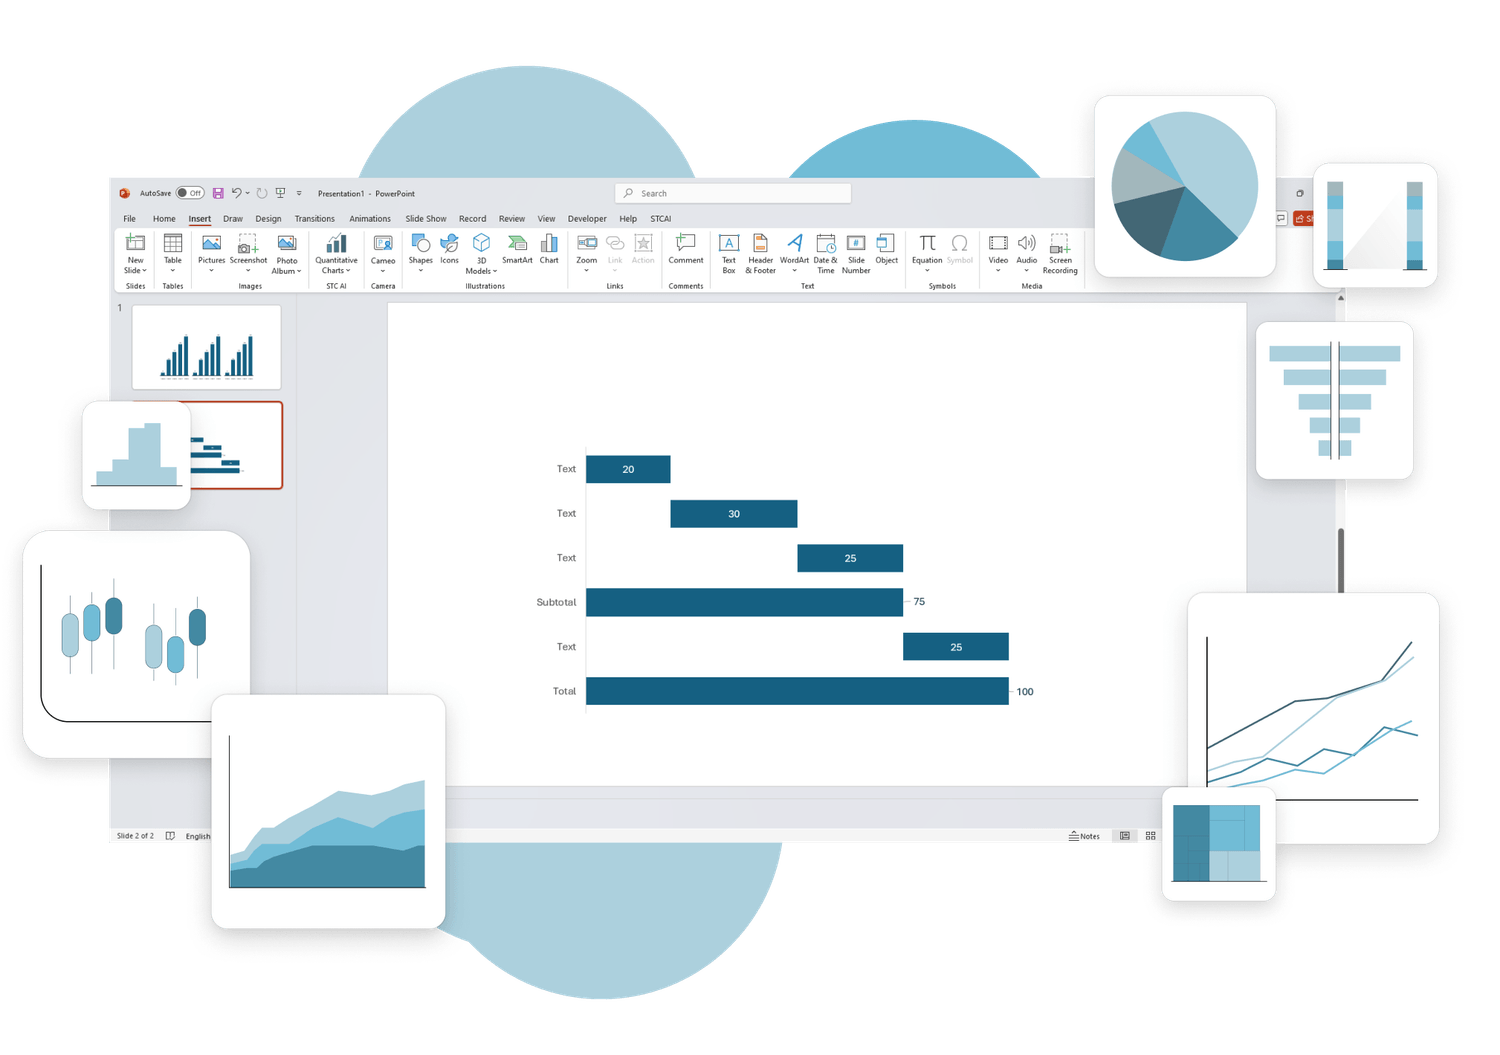
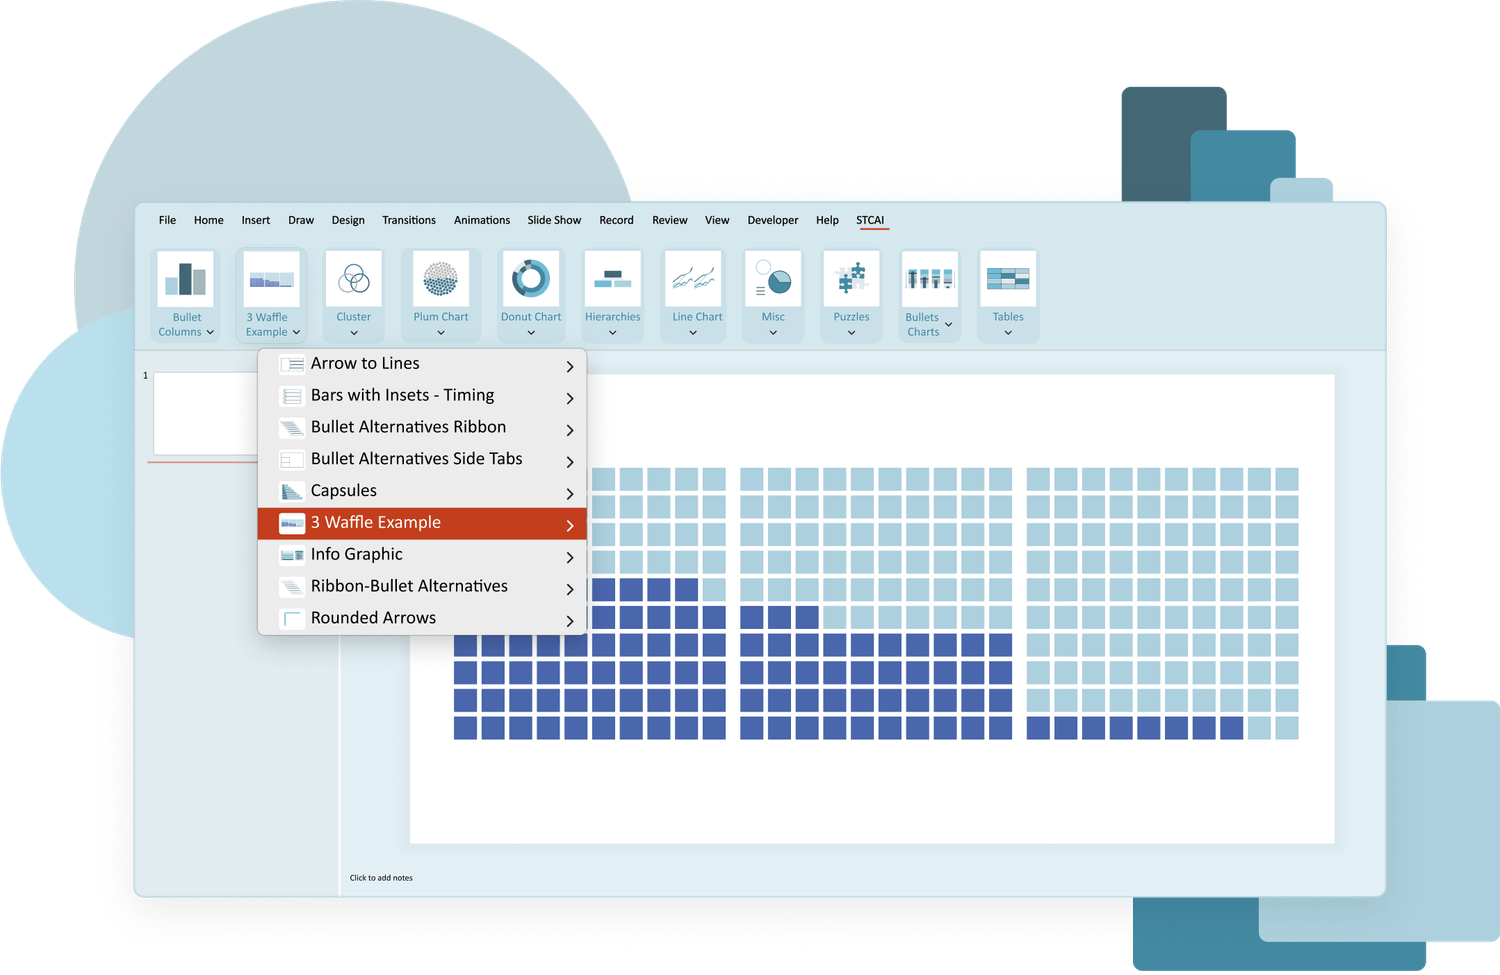
He is the creator of Storytelling Charts Add-In (STCAI), a free PowerPoint plugin that democratizes the charting and visual storytelling tools once reserved for elite consultants.
Through this book, his workshops, and his software, Sam is on a mission to make persuasive data storytelling accessible to everyone - from students and civil servants to executives and entrepreneurs.
About The Author
Sam Schreim
Sam Schreim is a global consultant and data storytelling expert who has helped Fortune 500 companies, startups, and government agencies turn complex information into clear, compelling narratives.
Over a 20-year career spanning management consulting, venture capital, and executive coaching, he has developed frameworks and tools that bridge logic, design and persuasion.
He is the creator of Storytelling Charts Add-In (STCAI), a free PowerPoint plugin that democratizes the charting and visual storytelling tools once reserved for elite consultants.
Through this book, his workshops, and his software, Sam is on a mission to make persuasive data storytelling accessible to everyone - from students and civil servants to executives and entrepreneurs.
What Fellow Professionals Are Saying

Sam fixed slides we'd wrestled with for weeks. Our VP signed off the next day.
— Amie D., Senior Data Analyst
Sam Schreim's approach in the bestselling 'Storytelling Charts' revolutionized how I build presentations. This workshop took those concepts and made them incredibly practical. The AI module alone was worth the price!"
— Jean S., Senior Partner Management Consulting
My students were glued to the screen after I applied these techniques.
— Dr. Linda S., Lecturer
What Fellow Professionals Are Saying
Sam fixed slides we'd wrestled with for weeks. Our VP signed off the next day.
— Amie D., Senior Data Analyst
Sam Schreim's approach in the bestselling 'Storytelling Charts' revolutionized how I build presentations. This workshop took those concepts and made them incredibly practical. The AI module alone was worth the price!"
— Jean S., Senior Partner Management Consulting
My students were glued to the screen after I applied these techniques.
— Dr. Linda S., Lecturer
Workshop Format & Logistics

Format
Live, Interactive Virtual Workshop (Delivered via Zoom)

Duration
4 hours total, delivered in two 2‑hour live sessions with a take‑home practicum
Dates & Times
To be determined
Workshop Format & Logistics
Format
Live, Interactive Virtual Workshop (Delivered via Zoom)
Duration
4 hours total, delivered in two 2‑hour live sessions with a take‑home practicum
Dates & Times
To be determined
Your Investment in Data-Driven Influence: Just $297
For less than the cost of a single ineffective presentation or a missed opportunity, you can gain the skills to transform your data communication forever. This isn't an expense; it's an investment in your professional impact, efficiency, and career growth.
Early Bird Special: Just $197
Lock in your spot now and save $100 — limited-time offer for early decision-makers!
30‑Day "Worth Every Penny" Guarantee
Attend the workshop, put the methods into practice. If you don't feel it delivered massive value, email us within 30 days for a full refund — no questions asked.
30‑Day "Worth Every Penny" Guarantee
Attend the workshop, put the methods into practice. If you don't feel it delivered massive value, email us within 30 days for a full refund — no questions asked.
Frequently Asked Questions
This workshop is designed for professionals who need to communicate data effectively and drive action:
Analysts & Data Scientists who want their insights to be understood and acted upon.
Managers & Team Leaders who need to present performance data, business cases, or strategic plans.
Marketing Professionals aiming to create more persuasive, data-backed campaigns and reports.
Sales Professionals looking to enhance their pitches with compelling data stories.
Consultants & Advisors who need to clearly communicate complex findings to clients.
Entrepreneurs & Business Owners seeking to secure investment or drive growth through data.
Anyone who has read the bestseller "Storytelling Charts" and wants to take their skills to the next level.
This intensive workshop is packed with actionable strategies and hands-on learning:
Module 1: Foundations of Storytelling Charts & The Power of Vertical Logic
• Understand why traditional charts fail and how storytelling transforms data communication.
• Deep dive into the "Vertical Logic" framework: the secret to building intuitively clear and persuasive visual narratives.
• Identify your core message and audience for maximum impact.
Module 2: Leveraging AI for Accelerated Chart Ideation, Design & Presentation Impact
• Discover the best AI tools for chart creation, data interpretation, and slide design.
• Learn effective prompting techniques to get the most out of AI for your specific data storytelling needs.
• Streamline your workflow: from raw data to polished, AI-enhanced charts in record time.
Module 3: The Harvard Case Method in Action: Deconstructing and Presenting a Real-Life Data Story
• Engage in a practical, real-world case study, applying the Harvard Business Case Method.
• Learn to analyze complex datasets, identify key insights, and structure a compelling narrative.
• Develop skills in presenting data-driven arguments persuasively and defending your conclusions.
Module 4: Applying Critical Thinking to Your Communication Strategy for Maximum Resonance
• Master Techniques for audience analysis and message framing
• Learn to anticipate questions, address potential skepticism and build trust through transparent data communications.
• Develop a strategic approach to ensure your data stories lead to desired outcomes.
Module 5: Crafting High-Impact Decks & Delivering Your Data Story with Confidence
• Integrate all learned principles into designing compelling presentation decks.
• Techniques for structuring your narrative across multiple slides for sustained engagement.
• Tips for confident delivery, handling Q&A, and ensuring your message sticks.
This workshop is designed to be accessible. We'll cover AI concepts relevant to chart creation and presentation in a clear, practical way. No advanced technical skills are required, just a willingness to learn.
The principles taught are software-agnostic. We will demonstrate some AI tools that are readily available (many with free tiers), but the focus is on the methodology you can apply anywhere. For the case study and exercises, standard presentation software (like PowerPoint) and spreadsheet software (like Excel or Google Sheets) will be useful.
While the core learning happens during the live sessions, you might have some light pre-reading for the case study or optional practice exercises. The primary commitment is your active participation during the workshop hours.
All sessions will be recorded and made available to participants after the workshop, so you can catch up on anything you miss.
Please contact us at support@storytellingcharts.com for information on group enrollments.
Don't let your valuable data insights get lost in translation.
It's time to become a master of data storytelling.
The ability to transform data into compelling narratives is no longer a niche skill — it's a fundamental requirement for professional success. This workshop provides the most current, integrated, and actionable approach to mastering this art, supercharged with the power of AI.
Claim your spot now - lock in the early-bird rate.
Secure your spot today to avoid disappointment and take the first step towards becoming a truly impactful data storyteller!
* Spaces are limited to ensure a high-quality, interactive experience for all participants.
Claim your spot now - lock in the early-bird rate.
Secure your spot today to avoid disappointment and take the first step towards becoming a truly impactful data storyteller!
* Spaces are limited to ensure a high-quality, interactive experience for all participants.